Silver has a real supply problem, but the chart still leaves room to smack buyers around before any big upside move. That’s the ugly beauty of silver as an investment: the fundamentals can be solid while the price behaves like it has unresolved issues.
- Supply deficits: Silver has been in shortage for several years, according to the chart and supply data cited by analyst Lukas Ekwueme.
- Industrial demand: A growing share of silver is being absorbed by electronics, solar, grid buildouts, automotive uses, and related industrial sectors.
- Technical risk: The daily chart still allows for a sharp pullback before a larger breakout can take hold.
- Key levels: Traders are watching support around $63.2, resistance near $71, and a later upside target around $89.
Lukas Ekwueme, who posts as @ekwufinance on X, says silver deficits are piling up and that cumulative shortfalls now exceed the equivalent of one year of silver mine production. He frames this as a market that has spent years consuming more silver than it has produced, while industrial demand keeps rising.
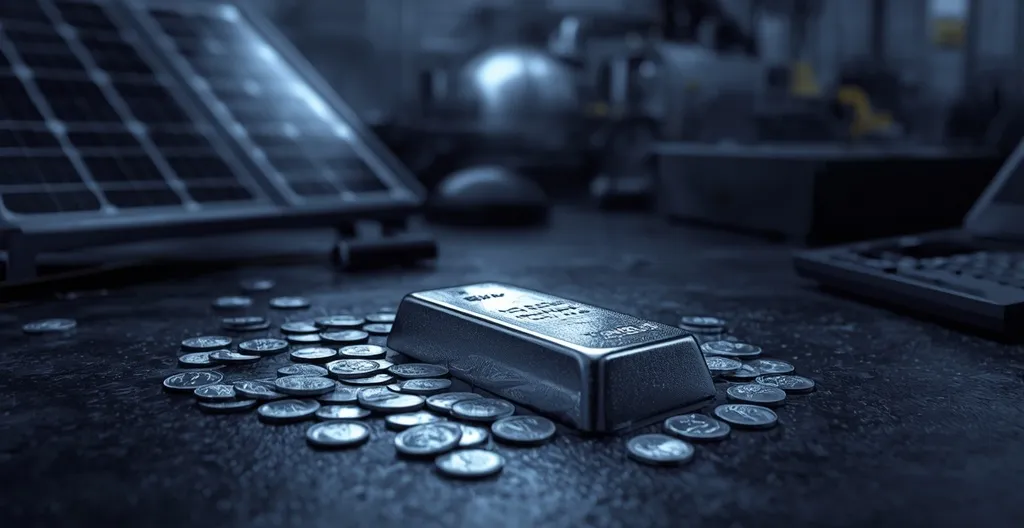
That basic thesis is credible. Silver is not just a shiny metal for stackers and gold bugs. It is also an industrial input, which means its price is influenced by electronics, electrical systems, solar panels, automotive applications, grid infrastructure, and other real-world uses that do not care whether the macro crowd is feeling bullish that week.
The supply side has shifted meaningfully in recent years. According to the data cited alongside the setup, silver posted annual supply surpluses from 2016 through 2020, then moved into deficit in 2021. The figures given are roughly 80 million ounces in 2021, about 250 million in 2022, around 200 million in 2023, and close to 150 million in 2024, with 2025 estimated to show another shortfall above 100 million ounces.
There is one problem: the year count is inconsistent. Ekwueme describes the market as being in the sixth consecutive year of deficits, while the chart framing shown with the setup points to a fifth consecutive year spanning 2021 through 2025E. That mismatch should not be brushed aside. If the count matters, it needs to be stated carefully.
The bigger point still stands. Industrial demand has become a much larger slice of the silver market. The figures cited put industrial demand at about 46% of total demand in 2016, rising to roughly 67% in the 2025 estimate. That is a major shift. It means silver is increasingly being pulled by manufacturing and technology demand, not just by investors hunting for a hedge or a trade.
The Silver Institute’s 2024 data, which supports the broader shortage narrative, adds more context. It reported total silver demand at 1.16 billion ounces in 2024, down 3% year over year, while industrial demand still posted another record. Mine production rose 0.9% to 819.7 million ounces, and recycling increased 6% to 193.9 million ounces, a 12-year high.
That matters because it shows silver supply is not collapsing. It is responding. The bullish case is not that production has vanished into thin air. It is that demand has stayed strong enough to keep the market tight even as supply inches higher. That is a more serious argument than the usual “to the moon” noise that clogs precious-metals timelines.
There is also an important counterpoint here: thrifting and substitution. In plain English, that means industries try to use less silver per unit of output, or replace it where they can, especially when prices rise. The Silver Institute notes that substitution remained limited across most sectors, though PV applications have seen some reduction in silver loadings. So the long-term demand story is strong, but it is not a free pass to assume industrial use will grow forever without resistance.
Winston Wolfe, posting as @MrWWolfe on X, brings the technical side of the argument. His long-range chart shows silver breaking above a large downward trendline that had contained price for years, with the setup extending through 2027. In his view, silver could eventually move toward roughly $70, then the $89 to $95 region, with possible corrections along the way into the high $50s, low $70s, and mid $80s.
His chart also marks about $51.50 as a level that “MUST HOLD” and roughly $121.94 as a level that “MUST BREAK.” Those are chartist reference points, not guarantees. They are useful as a map, not a prophecy. Silver has a habit of turning confident technical setups into expensive lessons.
On the daily chart, silver has reportedly been trapped in a range since August 10, with boundaries around $63.3 on the downside and $71 on the upside. A drop below about $63.2 would be the first major bearish signal and could open a move toward the $53 to $50 area. A move above $71 would be the first meaningful bullish breakout, with about $77 then in reach and, if momentum continues, roughly $89 later.
That is the tension in silver right now. The supply story is constructive. The technical picture is still fragile. Both can be true at once.
The broader lesson is worth stating plainly: a market can be fundamentally tight and still get hammered by positioning, liquidity shifts, a stronger dollar, or plain old trader behavior. Deficits matter, but they do not always translate into instant price action. Inventories can cushion the blow, and recycling can soften the squeeze. Markets are rude like that.
The official market shorthand for silver is XAG, which refers to one troy ounce of silver in financial markets. The FAQ cited a spot price around $66.90 per ounce, though live metals pricing moves constantly and should always be checked against a current feed.
For investors, silver remains a two-sided asset: it can serve as a diversification tool and a hedge against monetary disorder, but it also comes with sharp volatility and plenty of false starts. The long-term supply picture looks better than the usual silver pessimism suggests. The short-term chart, however, still has room to punish anyone treating the next breakout like a foregone conclusion.
“Silver deficits are piling up.”
“How long can the market ignore these fundamentals?”
That is the real question. Markets can ignore shortages longer than most traders expect. But when the deficits persist, industrial demand keeps expanding, and the technical structure tightens, the odds slowly start to shift.
Key questions and takeaways
-
Is silver really in a supply deficit?
Yes. The cited figures point to repeated annual deficits starting in 2021, but the materials are inconsistent on whether this is the fifth or sixth straight year. The broader shortage thesis is still intact. -
Why does industrial demand matter so much?
Because silver is used in electronics, electrical systems, solar, automotive, and grid infrastructure. This is real industrial consumption, not just investor demand or monetary speculation. -
Can silver still fall even if the fundamentals are bullish?
Absolutely. The daily chart setup allows for a break below about $63.2, which could send silver toward the $53 to $50 area before any larger advance resumes. -
What level would confirm more upside?
A move above roughly $71 would be the first bullish trigger in the cited chart setup, with $77 and then about $89 becoming the next upside checkpoints. -
Is this a straight-line rally setup?
No. Even the bullish long-range view allows for sizable corrections, including possible dips into the high $50s, low $70s, and mid $80s along the way. -
What is XAG?
XAG is the market shorthand for silver, with one troy ounce used as the standard unit in financial quoting.
Silver does not need a perfect macro backdrop to move higher. It just needs the market to stop treating supply deficits like background noise and start pricing them like they matter.
Further reading
A few related pieces and source materials for the silver crowd and the chart-watchers.
- Silver Price Prediction: This Supply Crisis Could
- Silver Mine Production and Demand Trends in 2024
- Troy: A Spectacular Retelling of The Iliad
- Kitco market data and precious metals services
- Silver Industrial Demand Reached a Record 680.5 Moz in 2024
- Silver Investment Outlook Mid-Year 2025
- Silver Bull Trap? Fakeout Rally Fails at Resistance as Long-Term Demand Holds
- Silver Surges to $121: Can It Rival Bitcoin as the Ultimate Safe Haven
- Silver Could Outperform Gold Before Year-End as Rates and Industrial Demand Drive the Trade