Gold’s recent selloff has traders leaning hard to the downside, but one analyst says that crowded bearish bet may be exactly why a bounce is coming. After a correction of more than 25% from January highs above $5,600 to roughly $4,155, the gold price prediction for next week from Itsadiee_Fx calls for a possible bullish weekly candle next week if a key support zone holds.
- 25%+ correction from January highs
- Key support: $4,136-$4,084
- Key resistance: $4,383
- Bearish crowd risk: sellers may get trapped
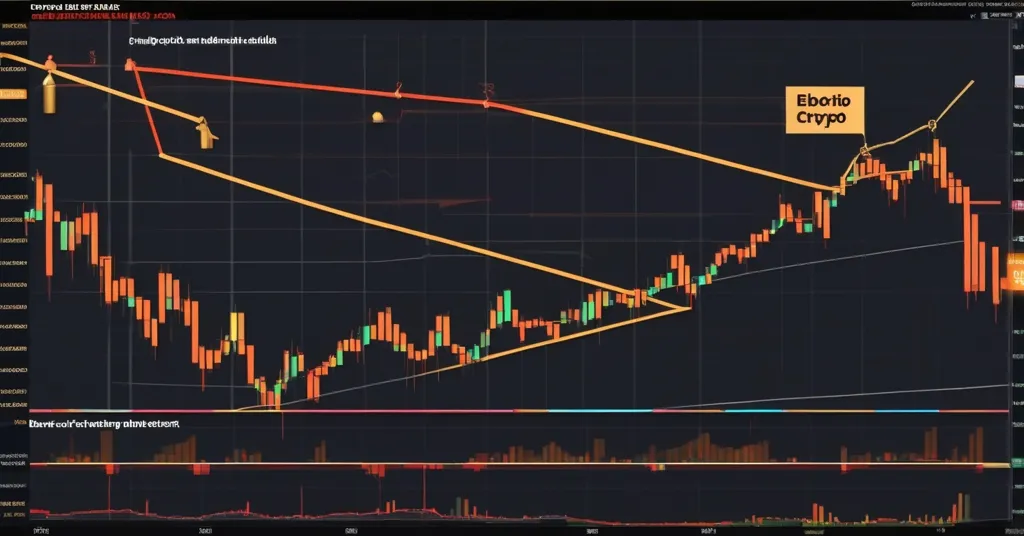
Gold price analysis: what the chart is saying
The setup is simple enough on paper, even if the chart is acting like it has a grudge. Gold has been making lower lows, and plenty of traders are now eyeing a clean move toward the closely watched $4,000 level. That’s the obvious trade. Which is exactly why some market watchers think it may not work out so neatly.
Itsadiee_Fx, a trader whose view was shared on TradingView and highlighted by CaptainAltcoin, argues that the market may be setting up a trap for sellers. In market terms, a trap happens when traders pile into one side of the trade too aggressively, only for price to reverse and punish the crowd. No conspiracy needed. Markets are perfectly capable of being nasty all by themselves.
The analyst expects gold to print a bullish weekly candle next week, with the key pivot sitting around the $4,136-$4,084 support zone. If that area holds, the next likely target is a rebound toward $4,383, with a possible extension toward $4,400.
That $4,383 zone matters for a reason. Gold rejected from there on October 17, 2025, and then rejected again during the recent FOMC reaction last week. Repeated rejection from the same area makes it a clear resistance level, not just a random line drawn by somebody with too much coffee and a TradingView subscription.
Why sellers may be walking into a trap
The main argument behind the bullish call is market structure. That simply means the pattern of higher highs, lower lows, support, and resistance that traders use to judge whether momentum is building or fading. In this case, the structure is still bearish overall, but the most recent price action hints that downside momentum may be losing steam.
Last week did not sweep the previous week’s low and instead closed higher. That matters because a market that fails to take out the prior low can be signaling exhaustion rather than fresh downside strength. The June 11 daily candle is also being described as a strong liquidity sweep candle, which means price moved sharply enough to run stop-loss orders below obvious levels before reversing. That kind of move is often watched closely because strong sweep candles are rarely broken directly without a reaction first.
In simpler terms: price can briefly dip below support, trigger a bunch of stops, and then rip higher if sellers overcommit. That is the “liquidity sweep” idea in plain English. It’s not magic. It’s just how crowded trades get punished.
“If you trade gold next week without seeing this, you’re taking a big risk.”
“The market may not allow sellers to achieve this so easily.”
“Last week did not sweep the previous week’s low and instead closed on the upside.”
“Such strong candles are rarely broken directly.”
That doesn’t guarantee a rally, but it does explain why the short side may be more fragile than the crowd expects. When everyone sees the same breakdown and crowds into the same bearish setup, the market often does the most annoying thing possible: it squeezes them first.
The levels traders are watching now
The most important zone on the chart is still $4,136-$4,084. As long as gold holds above that band, the bullish case stays alive. The analyst was blunt about it:
“As long as gold is trading above this zone, I am not interested in selling.”
If the support zone fails, the downside picture opens up fast. A break below $4,136-$4,084 could expose $4,025 and then the big psychological level at $4,000. That round number matters because traders love round numbers, banks love round numbers, and stop-loss clusters often gather around them like pigeons around stale bread.
The key bullish trigger would be a reclaim of $4,383. That would strengthen the case that buyers have regained control and that the recent decline was more of a shakeout than a clean trend continuation. The analyst also noted that a strong 1-hour candle closing below it with volume would be needed to make the bearish case more convincing. Translation: don’t call the breakdown until the market actually proves it.
Macro pressure is still hanging over gold
Even with the technical case for a bounce, the broader macro backdrop is still a headache for gold bulls. A hawkish Federal Reserve, a strong U.S. dollar, and easing geopolitical tensions all lean against a clean reversal.
The Federal Open Market Committee, or FOMC, is the Fed’s policy-setting arm. When it sounds hawkish, it usually means the central bank is more willing to keep rates elevated or stay restrictive for longer. That tends to support the dollar and pressure gold, since gold does not pay interest and often struggles when real yields remain elevated.
A stronger dollar also matters because gold is priced globally in U.S. dollars. When the dollar rises, gold can become more expensive for buyers using other currencies. That can dampen demand even if the chart looks like it wants to bounce. And when geopolitical fear cools off, one of gold’s classic safe-haven tailwinds loses force.
That’s the main counterpoint to the bullish chart setup: the technical picture may be hinting at a short-term squeeze, but the macro environment is not exactly rolling out the red carpet for a sustained breakout.
What could happen next
If the $4,136-$4,084 support zone holds, gold could stage a short-term rebound toward $4,383 and possibly $4,400. That would fit the analyst’s view that sellers may be trapped after leaning too hard into the downside.
If the support zone breaks cleanly, the bearish crowd gets what it wants: a move toward $4,025 and then $4,000. In that case, the market would be telling traders that the correction still has room to run and that the recent bounce setup was just noise.
There’s no need to overcomplicate it. Gold is sitting at a decision point. The chart says a squeeze higher is possible. The macro backdrop says be careful, because the path of least resistance may still be lower unless buyers prove otherwise.
Key takeaways
- Gold has corrected more than 25% from January highs above $5,600 to around $4,155.
- Itsadiee_Fx expects a bullish weekly candle next week if support holds.
- $4,136-$4,084 is the key support zone to watch.
- $4,383 remains the main resistance level and a reclaim there would strengthen the bullish case.
- $4,000 remains the major downside target if support breaks.
- Hawkish Fed policy, dollar strength, and easing geopolitical tensions still weigh on the gold price forecast.
Gold price prediction Q&A
What is the short-term outlook for gold?
Gold could stage a short-term rebound next week if the $4,136-$4,084 support zone holds.
Why are traders watching $4,000?
It is a major psychological level and a natural target if the current support band fails.
Why does the analyst think sellers may be trapped?
Because sentiment is heavily bearish and recent price action suggests downside momentum may be tiring.
What is a liquidity sweep?
It is a move that briefly breaks below a low to trigger stop-loss orders before price reverses.
What would confirm the bullish case?
A reclaim of $4,383, especially with strong price action and follow-through.
What would strengthen the bearish case?
A clean break below $4,136-$4,084, ideally confirmed by a strong lower-timeframe close with volume.
What macro factors are pressuring gold?
A hawkish Federal Reserve, a strong U.S. dollar, and easing geopolitical tensions.
Is a bounce guaranteed?
No. The technical setup is plausible, but macro conditions still make a clean upside reversal far from certain.